
A 50-Year+ Experiment
60 Hectares. ~90,000 Trees Censused. 90+ Species of Woody Plants
The Paint Rock Forest Dynamics Plot, developed under the direction of the founding scientists of the Smithsonian ForestGEO network, is the backbone of our forest research. It’s a 150-acre outdoor laboratory designed to reveal how one of North America’s most diverse temperate forests came to be so rich, and how its genetics may contribute to forests throughout Eastern North America.
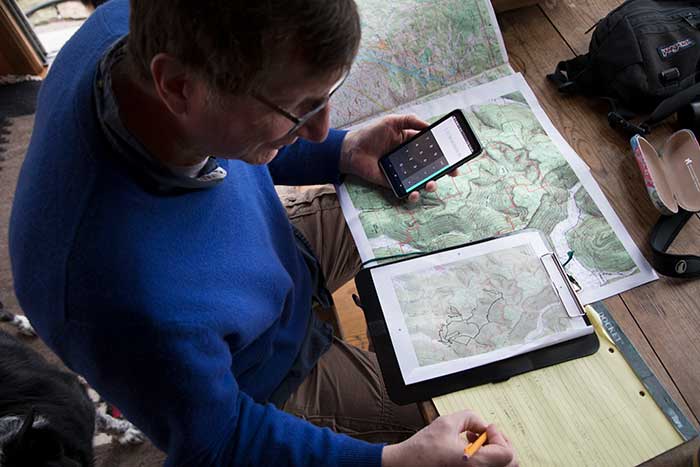
Over the course of nearly a decade, teams from Paint Rock Research Center, Alabama A&M University, and other partner institutions have measured, identified, tagged, geolocated, and mapped some 90,000 trees across 60 hectares of forest. Every stem larger than a pencil has been individually documented.
The scale is difficult to comprehend until you stand inside it. Trees stretch in every direction, each carrying its own identification tag and precise location in the forest. More than 50 researchers, students and field scientists have contributed to the effort, working for years across steep hills, rocky slopes, and dense forest.
But the first census is only the beginning.
The same trees will be measured repeatedly over the next 50 years as part of the Smithsonian ForestGEO program, creating an unprecedented long-term record of forest change. These recurring censuses will allow researchers to track growth, mortality, reproduction, carbon storage, species distributions, and responses to climate, fire, disease and other environmental pressures.
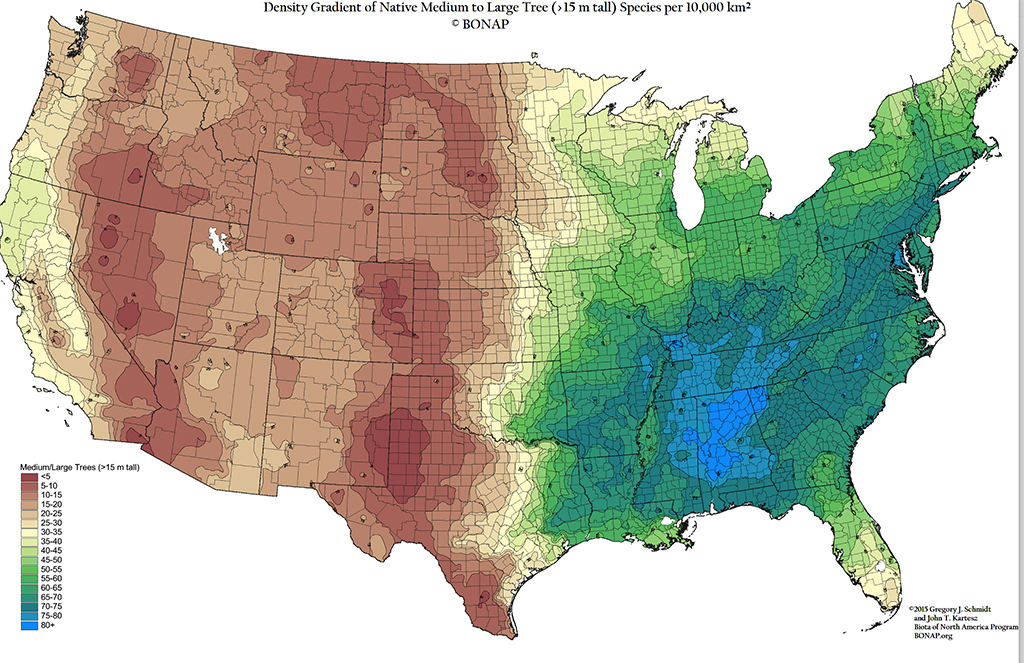
The plot is already producing surprises. Paint Rock appears to contain more tree species than any other forest dynamics plot in the temperate world. Researchers have encountered trees that do not fit neatly into existing species definitions, while rare and common species are distributed across the landscape in ways that suggest hidden relationships among geology, soil, water, fire, and forest history.
The Forest Dynamics Plot is both a living laboratory and a long-term scientific archive—one designed to answer questions that cannot be answered with a single season of fieldwork.
Partner Organizations
The scale and ambition of the Smithsonian ForestGEO Dynamics Plot depends on a growing network of scientists, universities and conservation organizations.
CORE RESEARCH PARTNERS
Paint Rock Research Center
Provides the research site, field infrastructure, coordination, data management, and long-term vision for the project.
Alabama A&M University
A central partner in the forest census, re-census, and student training program. Luben Dimov, Dawn Lemke, Patience Knight, Helen Czech, and more have played a large role in establishing the long-term monitoring program.
UCLA
UCLA Distinguished Professor Emeritus Stephen Hubbell, one of the world’s leading forest ecologists, has helped guide the scientific planning for the plot.
ADDITIONAL RESEARCH COLLABORATORS
Our growing network includes researchers and institutions from across the country, including:
- The Nature Conservancy
- University of Alabama
- Auburn University
- University of West Alabama
- University of Georgia
- University of North Carolina
- Austin Peay State University
- University of Vermont
- University of Alabama Huntsville
- University of New Hampshire
- University of Maine
- Yale University
- Morton Arboretum
- Chicago Field Museum
- Oak Ridge National Laboratory
- Student Conservation Association
- AmeriCorps
The project also depends on generations of student researchers. More than 30 interns have worked on the census, with students coming from Alabama and across the United States and the world. They are not simply collecting data—they are gaining the field experience, scientific skills and ecological perspective needed to become the next generation of conservation scientists.


Key Research Questions
The Forest Dynamics Plot is designed to function as a platform for many different kinds of research. As the dataset grows, so does the range of questions scientists can ask.
How does a forest change over time?
Which trees grow fastest? Which species decline? Which reproduce successfully? How long do individual trees live?
Repeated censuses will allow us to follow individual trees across decades and document the fundamental processes that determine how forests grow and change.
How will forests respond to a changing climate?
How do different species respond to drought, heat, changing rainfall and increasing atmospheric carbon dioxide?
Long-term growth and mortality data will provide a baseline for understanding how a diverse southeastern forest responds to a changing climate.
Why is Paint Rock so diverse?
The Paint Rock Dynamics Plot appears to contain more tree species than any other Smithsonian ForestGEO dynamics plot in North America. Why?
Researchers are investigating how geology, soil, topography, water, fire and forest history combine to create such extraordinary diversity.
What are these trees?
Some trees in the plot do not fit neatly into existing species classifications.
Researchers are working with taxonomists and geneticists at institutions including HudsonAlpha Institute for Biotechnology, Morton Arboretum, University of West Alabama, University of North Carolina, University of Georgia, and Austin Peay State University to better understand these unusual populations.
The work may ultimately change how scientists classify several groups of southeastern trees.
Can genetics help save threatened trees?
An ongoing full genome DNA census is investigating genetic differences among individual trees.
That information could prove critical for conserving species such as ash, elm, butternut, beech and black walnut as diseases and other threats move through North American forests.
What role has fire played?
Fire has shaped southeastern forests for thousands of years. Researchers are combining the forest census with studies of fire history to understand how past burning influenced the composition and structure of the Paint Rock forest.
How do forests interact with and depend on the underground world?
Cave researchers, including renowned scientist Hazel Barton, are exploring the deep hollows beneath the plot.
The work is revealing how underground geology influences the forest above while potentially providing access to ancient deposits that could tell us what Paint Rock looked like tens of thousands of years ago.
How do animals and plants interact?
Research connected to the plot includes studies of migratory birds, insects, bats, native wildflowers and ants.
One project with the University of Georgia and U.S. Forest Service researchers are examining whether invasive ants could replace native ants that play important roles in maintaining native wildflower communities.
Can we see the forest from above?
Lidar flights and remote-sensing research with Oak Ridge National Laboratory and universities in New England will use the precisely mapped ground data to test the accuracy of aerial and satellite measurements. The result could help scientists understand forests at much larger scales.
Related Publications and Insights
2026
Lemke, D., Dimov, L., Finch, W., Knight, P., Czech, H., Wenineger, L., Condit, R. (2026). Initial tree census for the Paint Rock Forest Dynamics Plot, Alabama, USA. Ecological Society of America. https://doi.org/10.1002/ecy.70348
2025
Lemke, D., Dimov, L., Czech, H., Knight, P., Finch, W., Condit, R. (2025). Relationship between topographic variables and live aboveground tree biomass on a large temperate forest plot. Forest Ecosystems. https://doi.org/10.1016/j.fecs.2025.100338